In the previous tutorial I showed you how we can develop a simple chart application using JFreeChart. Now let's do something interesting with that. We are going to read some data from a Arduino and show that in a java chart. We are using the Java RxTx library for communication and JFreeChart for displaying the chart. Lets' start then.
First we will write a simple application that would send some random data from Arduino. There are situations where you have to send some sensor values for processing in a Java application. So here I'm trying to send some values that will appear like some sensor values.
float sensor_values[3]; //declare an arrary of 3 float values
float val_1,val_2,val_3; //declare 3 sensor values

void setup()
{
  Serial.begin(9600); //Start serial

  // Generate 3 random numbers between -100 and +100
  val_1 = random(-100,100);
  val_2 = random(-100,100);
  val_3 = random(-100,100);

}

void loop()
{
  //if any value is equal to 100 start again from -100
  if(val_1 >= 100){
    val_1 = -100;
  }
  else{
    val_1++;
  }

  if(val_2 >= 100){
    val_2 = -100;
  }
  else{
    val_2++;
  }

  if(val_3 >= 100){
      val_3 = -100;
  }
  else{
    val_3++;
  }

  // Assign the values to array
  sensor_values[0] = val_1;
  sensor_values[1] = val_2;
  sensor_values[2] = val_3;

  //call the write sensor values function to write the values to serial port
  writeSensorValues(sensor_values);
}

//Method that will write the values to the serial port
void writeSensorValues(float values [])
{
  Serial.print("STX,"); //STX is used to identify the start of the string
  for(int i = 0 ; i < 3 ; i++){
    Serial.print(values[i]);
    Serial.print(","); // Seperate each value with ',' to identify them seperately
  }
  Serial.println("ETX"); //ETX is used to identify the end of the string
}
Now the Arduino code is complete. You can upload this code to your Arduino and check the output using the Serial Monitor.
Our next step is to write the Java Program that will read from the Arduino and display that data in a chart. I will get the help of the tutorials on Java RxTx for Serial Communication and JFree Chart tutorial to do this. I have described how to add the RxTx and JFreeChart libraries to the project in the above tutorials.
First create a class named 'SerialChart.java' and extend it from the ApplicationFrame class and implement the SerialPortEventListener class. Then add the constructor and add the unimplemented methods.

 private TimeSeriesCollection timeSeriesCollection; // Collection of time series data
 private XYDataset xyDataset; // dataset that will be used for the chart
 private TimeSeries seriesX; // X series data
 private TimeSeries seriesY; // Y series data
 private TimeSeries seriesZ; // X series data

 private BufferedReader input; // input reader
 private OutputStream output; //output reader
 private SerialPort serialPort; // serial port object

 private String [] PORT_NAMES = {"COM7"}; // available ports
Then let's start with a method that will initialize the serial port connection.
private void initializeSerial()
 {
  CommPortIdentifier portId = null;
  Enumeration portEnum = CommPortIdentifier.getPortIdentifiers();

  while(portEnum.hasMoreElements())
  {
   CommPortIdentifier currentPortIdentifier = (CommPortIdentifier)portEnum.nextElement();
   for(String portName : PORT_NAMES)
   {
    if(currentPortIdentifier.getName().equals(portName))
    {
     portId = currentPortIdentifier;
     break;
    }
   }
  }

  if(portId == null)
  {
   System.out.println("Port not found");
   return;
  }

  try {

   serialPort = (SerialPort)portId.open(this.getClass().getName(), 2000);
   serialPort.setSerialPortParams(9600, SerialPort.DATABITS_8, SerialPort.STOPBITS_1, SerialPort.PARITY_NONE);

   input = new BufferedReader(new InputStreamReader(serialPort.getInputStream()));
   output = serialPort.getOutputStream();

   serialPort.addEventListener(this);
   serialPort.notifyOnDataAvailable(true);

  } catch (Exception e) {
   System.err.println("Initialization failed : " + e.toString());
  }
 }
Now let's create the method to return a chart object.
 private JFreeChart createChart() {

        JFreeChart chart = ChartFactory.createTimeSeriesChart(
            "Sensor Data Display",  // title
            "Time",             // x-axis label
            "Sensor Value",   // y-axis label
            timeSeriesCollection,            // data
            true,               // create legend?
            true,               // generate tooltips?
            false               // generate URLs?
        );

        chart.setBackgroundPaint(Color.white);

        XYPlot plot = (XYPlot) chart.getPlot();

        DateAxis axis = (DateAxis) plot.getDomainAxis();
        axis.setAutoRange(true);
  axis.setFixedAutoRange(60000.0);

        return chart;
 }
We can complete the constructor now.
public SerialChart(String title) {
  super(title);

  initializeSerial();

  timeSeriesCollection = new TimeSeriesCollection();
  seriesX = new TimeSeries("SensorX");
  seriesY = new TimeSeries("SensorY");
  seriesZ = new TimeSeries("SensorZ");

  timeSeriesCollection.addSeries(seriesX);
  timeSeriesCollection.addSeries(seriesY);
  timeSeriesCollection.addSeries(seriesZ);

  JFreeChart chart = createChart();
  ChartPanel chartPanel = new ChartPanel(chart);
  chartPanel.setFillZoomRectangle(true);
  chartPanel.setMouseWheelEnabled(true);
  chartPanel.setPreferredSize(new java.awt.Dimension(1000,500));
  setContentPane(chartPanel);
 }
Next we have to complete the serialEvent method so that it will respond to the data received from Arduino.
 @Override
 public synchronized void serialEvent(SerialPortEvent event) {
  if(event.getEventType() == SerialPortEvent.DATA_AVAILABLE)
  {
   try
   {
    String inputLine = input.readLine();
    String [] inputValues = inputLine.split(",");

    if(inputValues[0].equals("STX") && inputValues[inputValues.length-1].equals("ETX"))
    {
     float in_x = new Float(inputValues[1]).floatValue();
     float in_y = new Float(inputValues[2]).floatValue();
     float in_z = new Float(inputValues[3]).floatValue();

     this.timeSeriesCollection.getSeries(0).add(new Millisecond(),in_x);
     this.timeSeriesCollection.getSeries(1).add(new Millisecond(),in_y);
     this.timeSeriesCollection.getSeries(2).add(new Millisecond(),in_z);
    }

    System.out.println(inputLine);
   }
   catch(Exception ex)
   {
    ex.printStackTrace();
   }
  }
 }
We also have to write a method to properly close the serial port event.
public synchronized void close()
 {
  if(serialPort != null)
  {
   serialPort.removeEventListener();
   serialPort.close();
  }
 }
Finally it's the main method to bring everything together.
 public static void main(String[] args) {

  SerialChart serialChartDemo = new SerialChart("Time Series Chart Demo");
        serialChartDemo.pack();
        RefineryUtilities.centerFrameOnScreen(serialChartDemo);
        serialChartDemo.setVisible(true);

    }
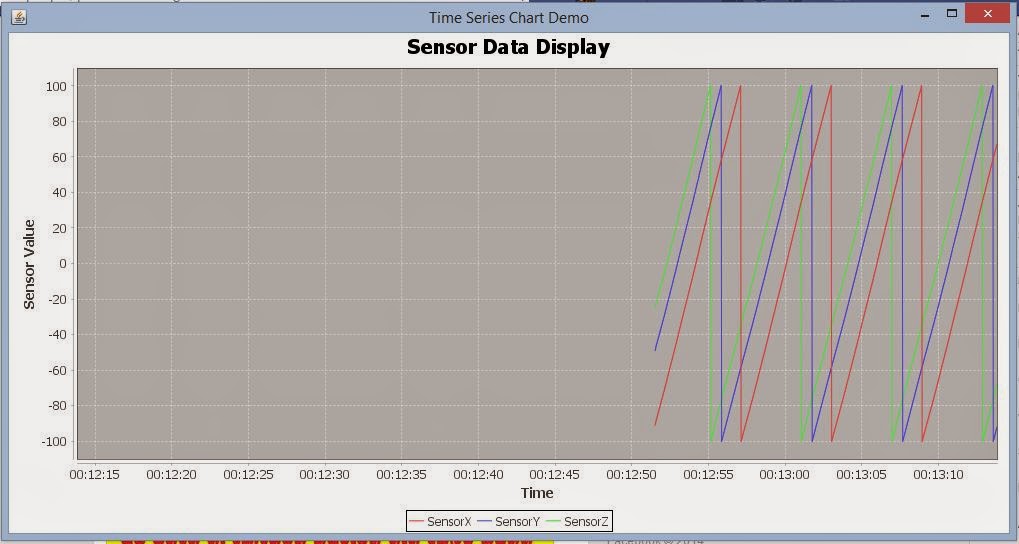
Now run the application and see the results :-). You'll get an output like this.
Following is the complete code.
package com.dc.rxtxjfreechart;

import java.awt.Color;
import java.io.BufferedReader;
import java.io.InputStreamReader;
import java.io.OutputStream;
import java.util.Enumeration;

import gnu.io.CommPortIdentifier;
import gnu.io.SerialPort;
import gnu.io.SerialPortEvent;
import gnu.io.SerialPortEventListener;

import org.jfree.chart.ChartFactory;
import org.jfree.chart.ChartPanel;
import org.jfree.chart.JFreeChart;
import org.jfree.chart.axis.DateAxis;
import org.jfree.chart.plot.XYPlot;
import org.jfree.data.time.Millisecond;
import org.jfree.data.time.TimeSeries;
import org.jfree.data.time.TimeSeriesCollection;
import org.jfree.data.xy.XYDataset;
import org.jfree.ui.ApplicationFrame;
import org.jfree.ui.RefineryUtilities;

public class SerialChart extends ApplicationFrame implements SerialPortEventListener {

 private TimeSeriesCollection timeSeriesCollection; // Collection of time series data
 private XYDataset xyDataset; // dataset that will be used for the chart
 private TimeSeries seriesX; // X series data
 private TimeSeries seriesY; // Y series data
 private TimeSeries seriesZ; // X series data

 private BufferedReader input; // input reader
 private OutputStream output; //output reader
 private SerialPort serialPort; // serial port object

 private String [] PORT_NAMES = {"COM7"}; // available ports

 public SerialChart(String title) {
  super(title);

  initializeSerial();

  timeSeriesCollection = new TimeSeriesCollection();
  seriesX = new TimeSeries("SensorX");
  seriesY = new TimeSeries("SensorY");
  seriesZ = new TimeSeries("SensorZ");

  timeSeriesCollection.addSeries(seriesX);
  timeSeriesCollection.addSeries(seriesY);
  timeSeriesCollection.addSeries(seriesZ);

  JFreeChart chart = createChart();
  ChartPanel chartPanel = new ChartPanel(chart);
  chartPanel.setFillZoomRectangle(true);
  chartPanel.setMouseWheelEnabled(true);
  chartPanel.setPreferredSize(new java.awt.Dimension(1000,500));
  setContentPane(chartPanel);
 }

 @Override
 public synchronized void serialEvent(SerialPortEvent event) {
  if(event.getEventType() == SerialPortEvent.DATA_AVAILABLE)
  {
   try
   {
    String inputLine = input.readLine();
    String [] inputValues = inputLine.split(",");

    if(inputValues[0].equals("STX") && inputValues[inputValues.length-1].equals("ETX"))
    {
     float in_x = new Float(inputValues[1]).floatValue();
     float in_y = new Float(inputValues[2]).floatValue();
     float in_z = new Float(inputValues[3]).floatValue();

     this.timeSeriesCollection.getSeries(0).add(new Millisecond(),in_x);
     this.timeSeriesCollection.getSeries(1).add(new Millisecond(),in_y);
     this.timeSeriesCollection.getSeries(2).add(new Millisecond(),in_z);
    }

    System.out.println(inputLine);
   }
   catch(Exception ex)
   {
    ex.printStackTrace();
   }
  }
 }

 private void initializeSerial()
 {
  CommPortIdentifier portId = null;
  Enumeration portEnum = CommPortIdentifier.getPortIdentifiers();

  while(portEnum.hasMoreElements())
  {
   CommPortIdentifier currentPortIdentifier = (CommPortIdentifier)portEnum.nextElement();
   for(String portName : PORT_NAMES)
   {
    if(currentPortIdentifier.getName().equals(portName))
    {
     portId = currentPortIdentifier;
     break;
    }
   }
  }

  if(portId == null)
  {
   System.out.println("Port not found");
   return;
  }

  try {

   serialPort = (SerialPort)portId.open(this.getClass().getName(), 2000);
   serialPort.setSerialPortParams(9600, SerialPort.DATABITS_8, SerialPort.STOPBITS_1, SerialPort.PARITY_NONE);

   input = new BufferedReader(new InputStreamReader(serialPort.getInputStream()));
   output = serialPort.getOutputStream();

   serialPort.addEventListener(this);
   serialPort.notifyOnDataAvailable(true);

  } catch (Exception e) {
   System.err.println("Initialization failed : " + e.toString());
  }
 }

 private JFreeChart createChart() {

        JFreeChart chart = ChartFactory.createTimeSeriesChart(
            "Sensor Data Display",  // title
            "Time",             // x-axis label
            "Sensor Value",   // y-axis label
            timeSeriesCollection,            // data
            true,               // create legend?
            true,               // generate tooltips?
            false               // generate URLs?
        );

        chart.setBackgroundPaint(Color.white);

        XYPlot plot = (XYPlot) chart.getPlot();

        DateAxis axis = (DateAxis) plot.getDomainAxis();
        axis.setAutoRange(true);
  axis.setFixedAutoRange(60000.0);

        return chart;
 }

 public synchronized void close()
 {
  if(serialPort != null)
  {
   serialPort.removeEventListener();
   serialPort.close();
  }
 }

 public static void main(String[] args) {

  SerialChart serialChartDemo = new SerialChart("Time Series Chart Demo");
        serialChartDemo.pack();
        RefineryUtilities.centerFrameOnScreen(serialChartDemo);
        serialChartDemo.setVisible(true);

    }
}
Hope that helps. Thank You. :-)
Found this code while searching on google. helped me in my reaserch. Kinath Thanx alot.
ReplyDeleteYou are welcome. Glad it helpd :-)
Deleteone help.
ReplyDeletehow to display the values got from the sensor in a pie-chart i.e. in the circle format